for 3D Spatial Perception in Remote Sensing
Overview
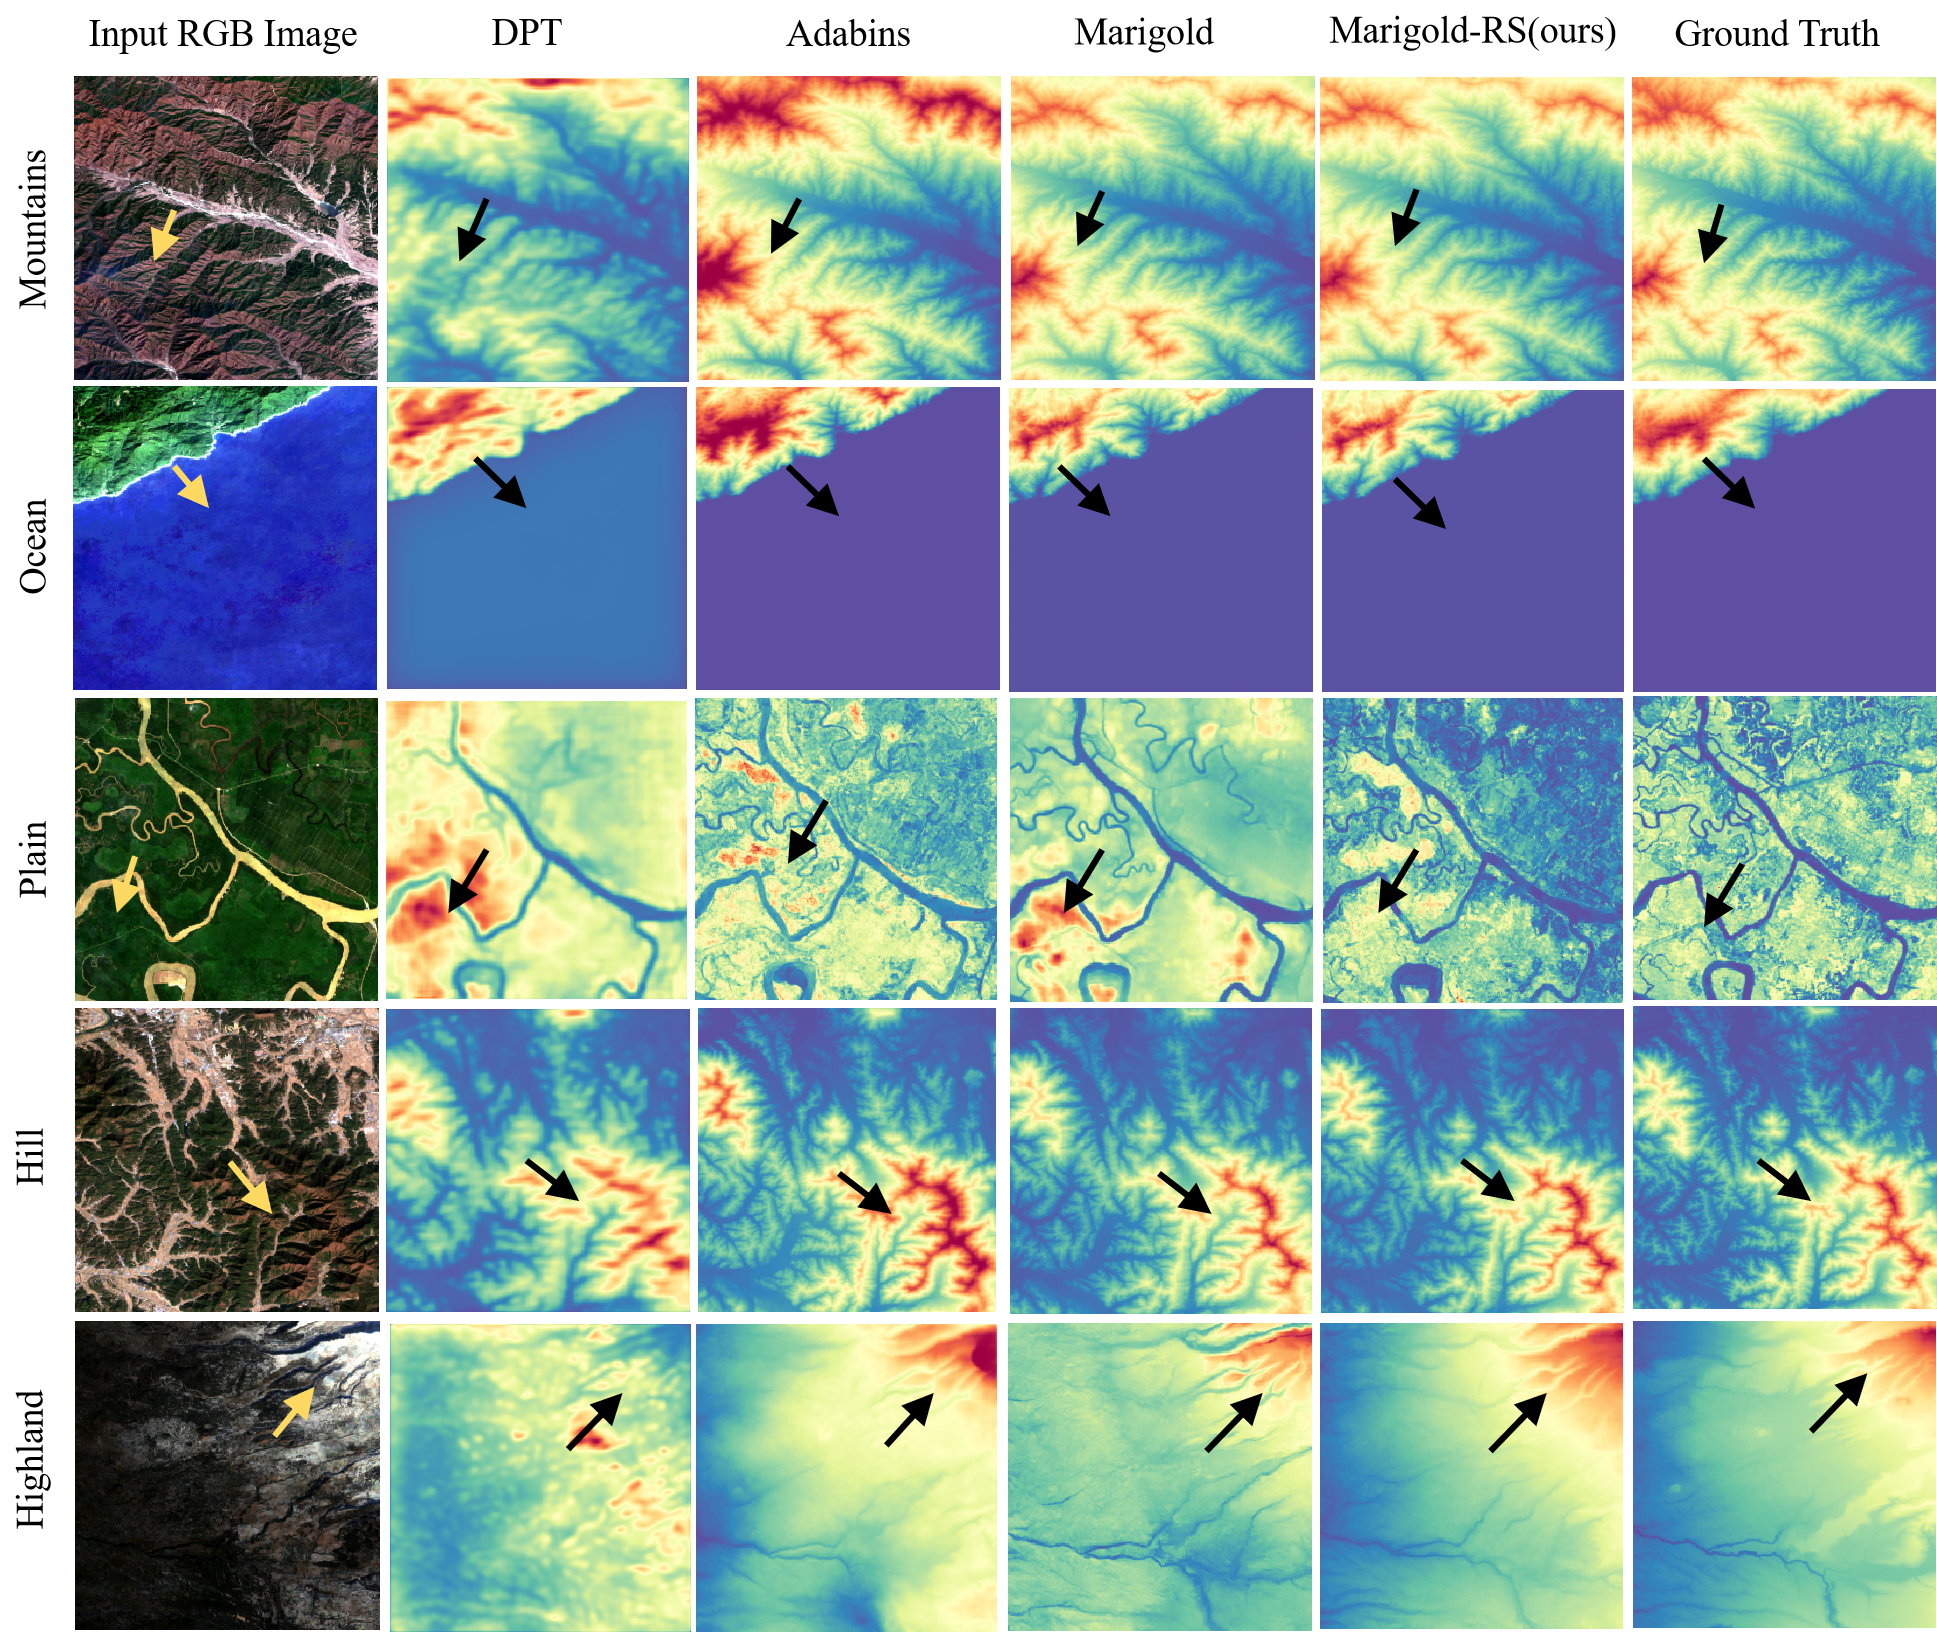
Current remote sensing datasets either lack comprehensive depth information or suffer from imprecise image-depth alignment. Furthermore, recovering depth from pure remote sensing images often leads to structural confusion and hallucinations due to visual ambiguity. To address these challenges, we propose RS3DBench, a large-scale, multi-region, and multi-resolution multimodal benchmark. RS3DBench comprises 54,951 strictly pixel-aligned pairs of remote sensing images and depth maps, enriched with accurate geographical text descriptions. Using this benchmark, we systematically evaluate nine advanced monocular depth estimation (MDE) models to reveal their capabilities and limitations in complex terrains. Moreover, we introduce a text-guided multimodal diffusion model that leverages explicit semantic priors to resolve structural ambiguities. Extensive experiments demonstrate the effectiveness of our approach, surpassing the strongest baseline, Marigold, by an average of 12.3% in MAE. This work provides a crucial foundational resource for 3D visual perception and geospatial artificial intelligence.
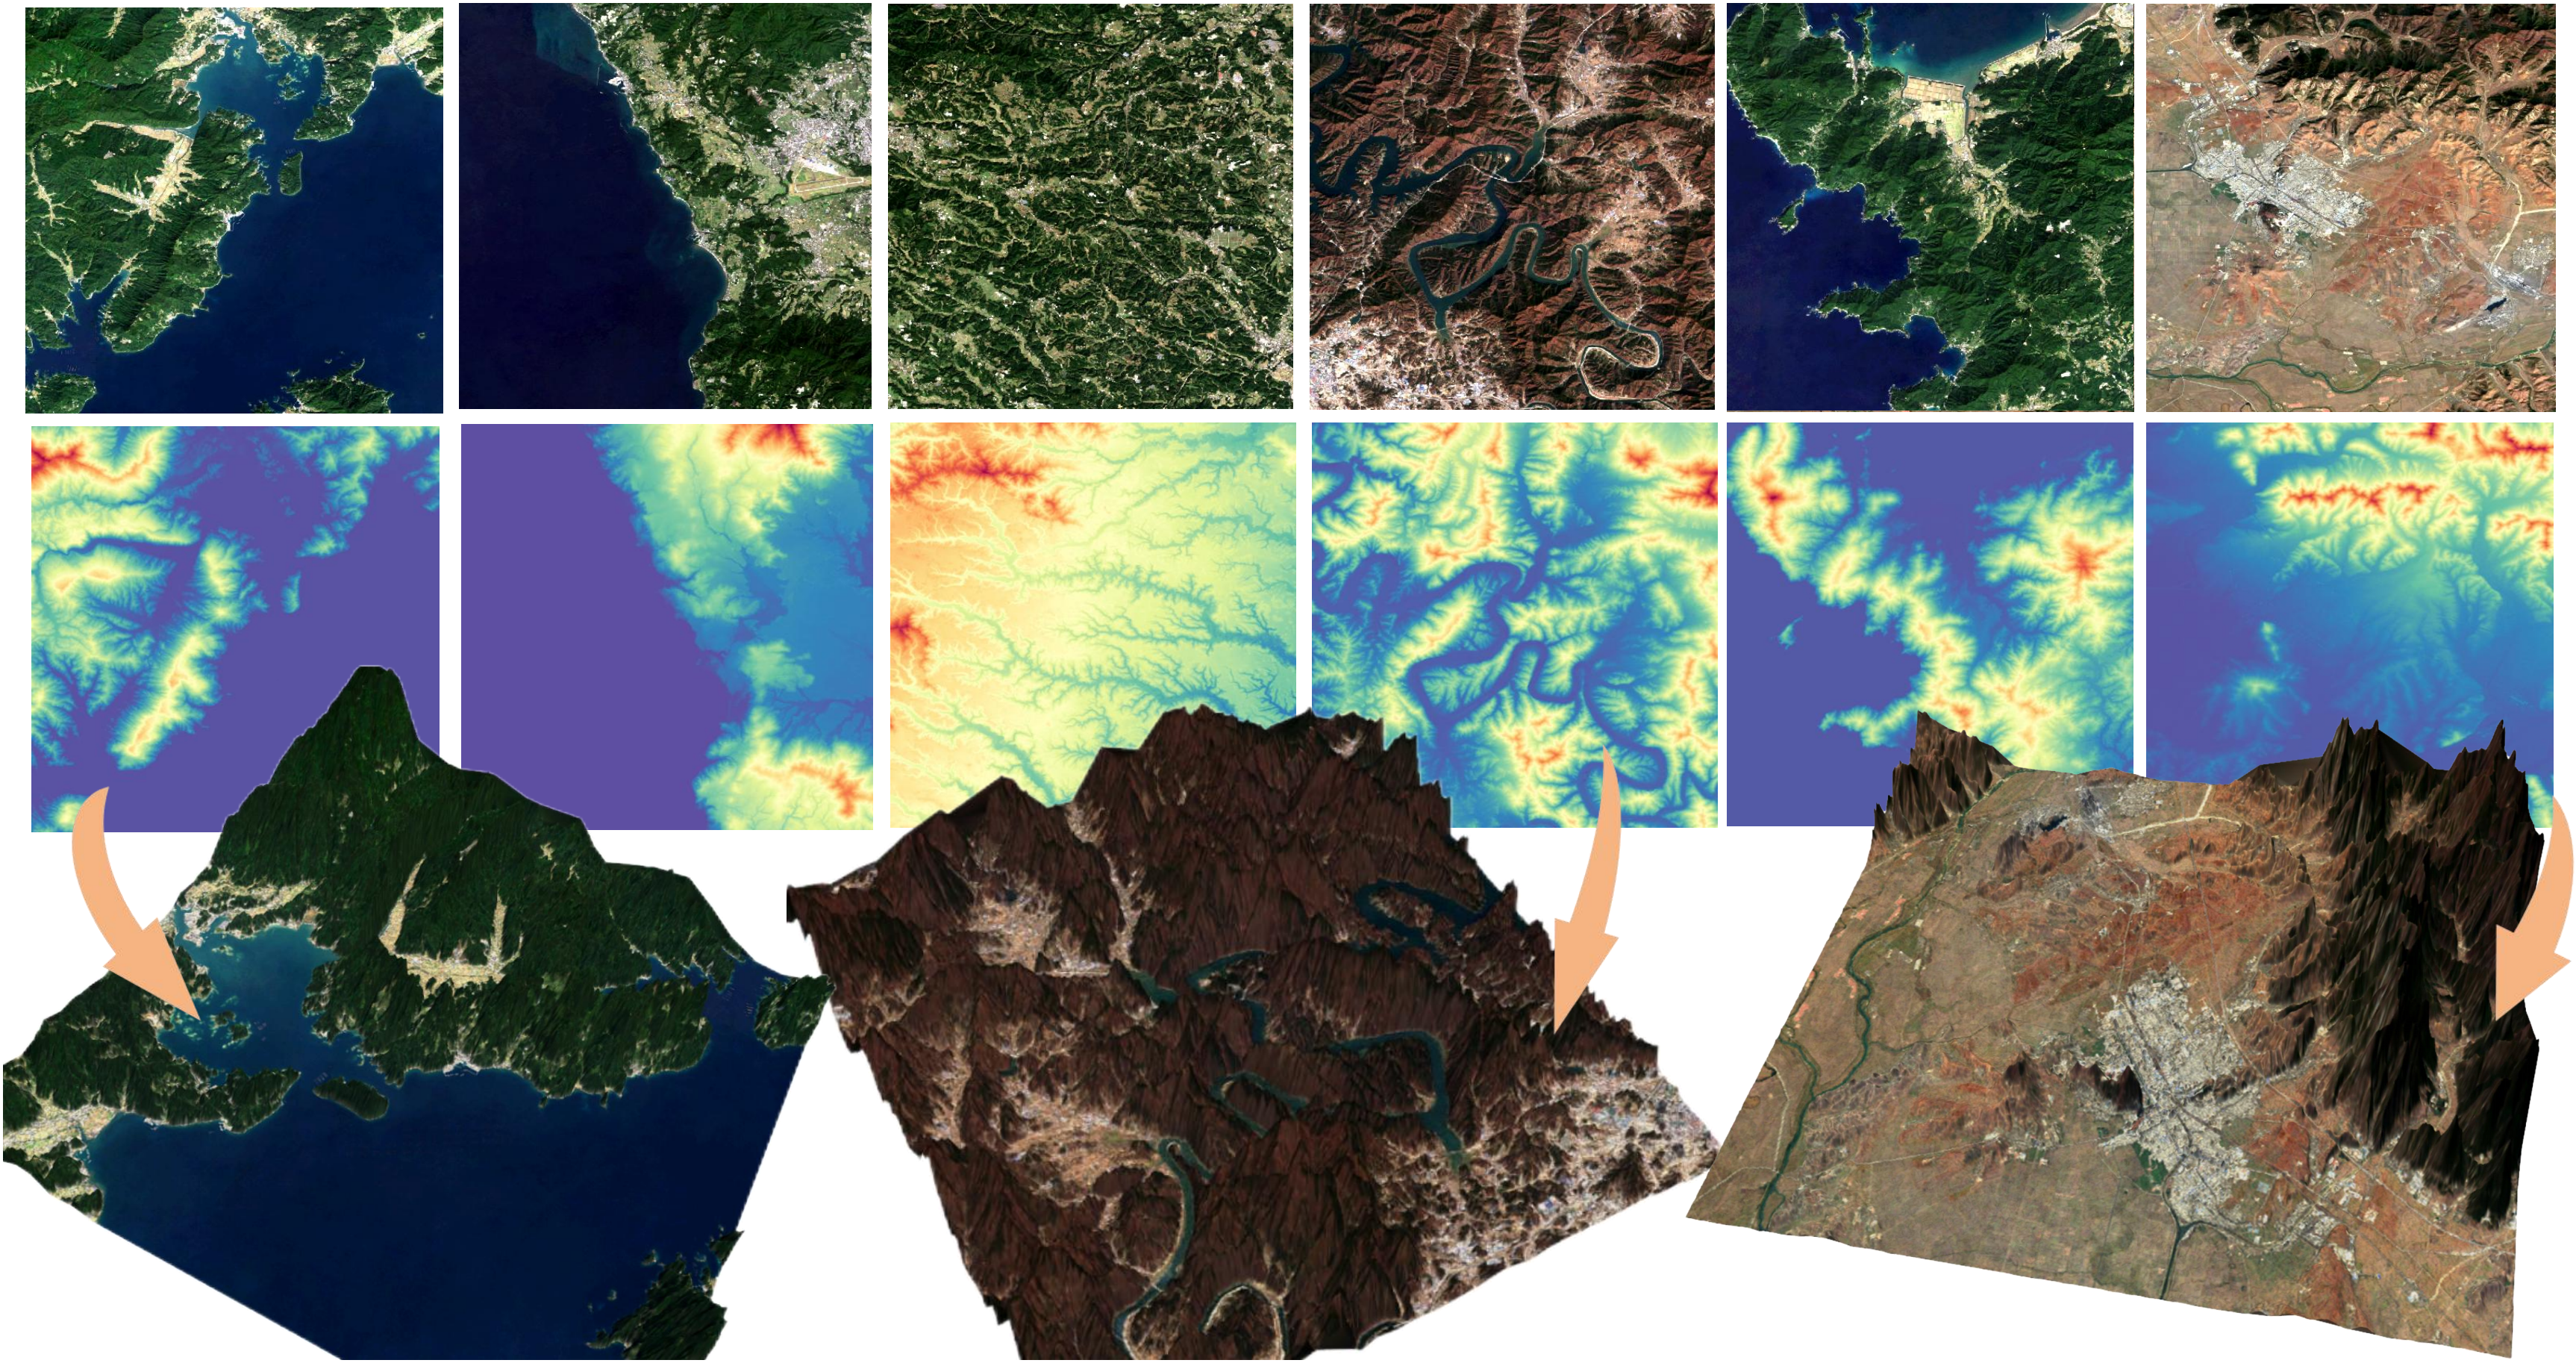
Dataset Gallery
Dataset Pipeline
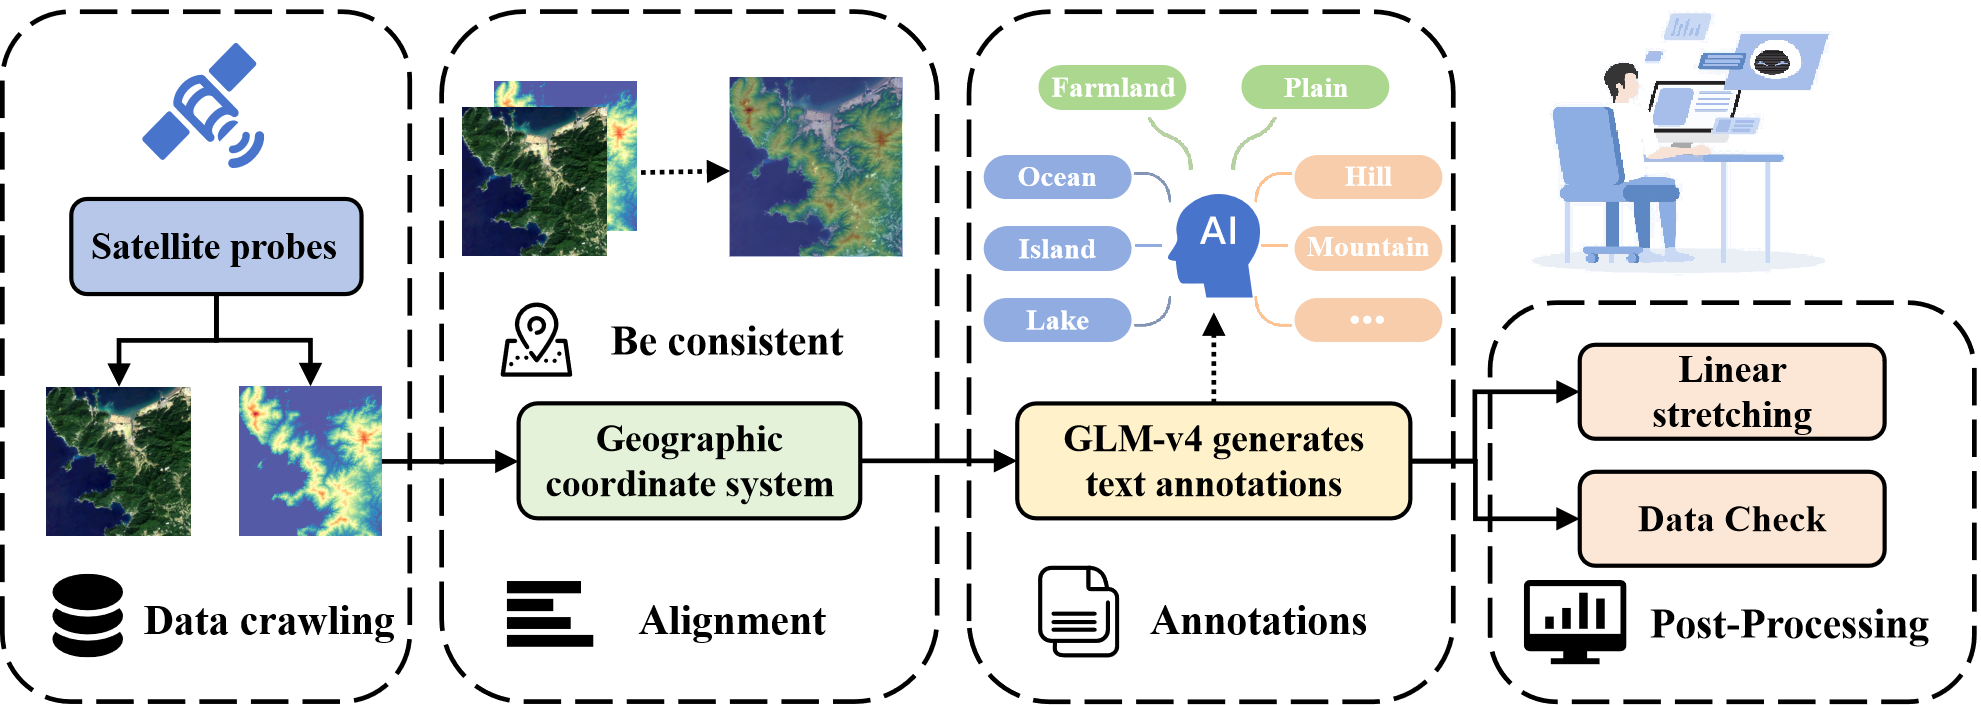
The pipeline of data collection of RS3DBench: (1) Data Crawling (2) Alignment (3) Annotations (4) Post-Processing
Dataset Analysis
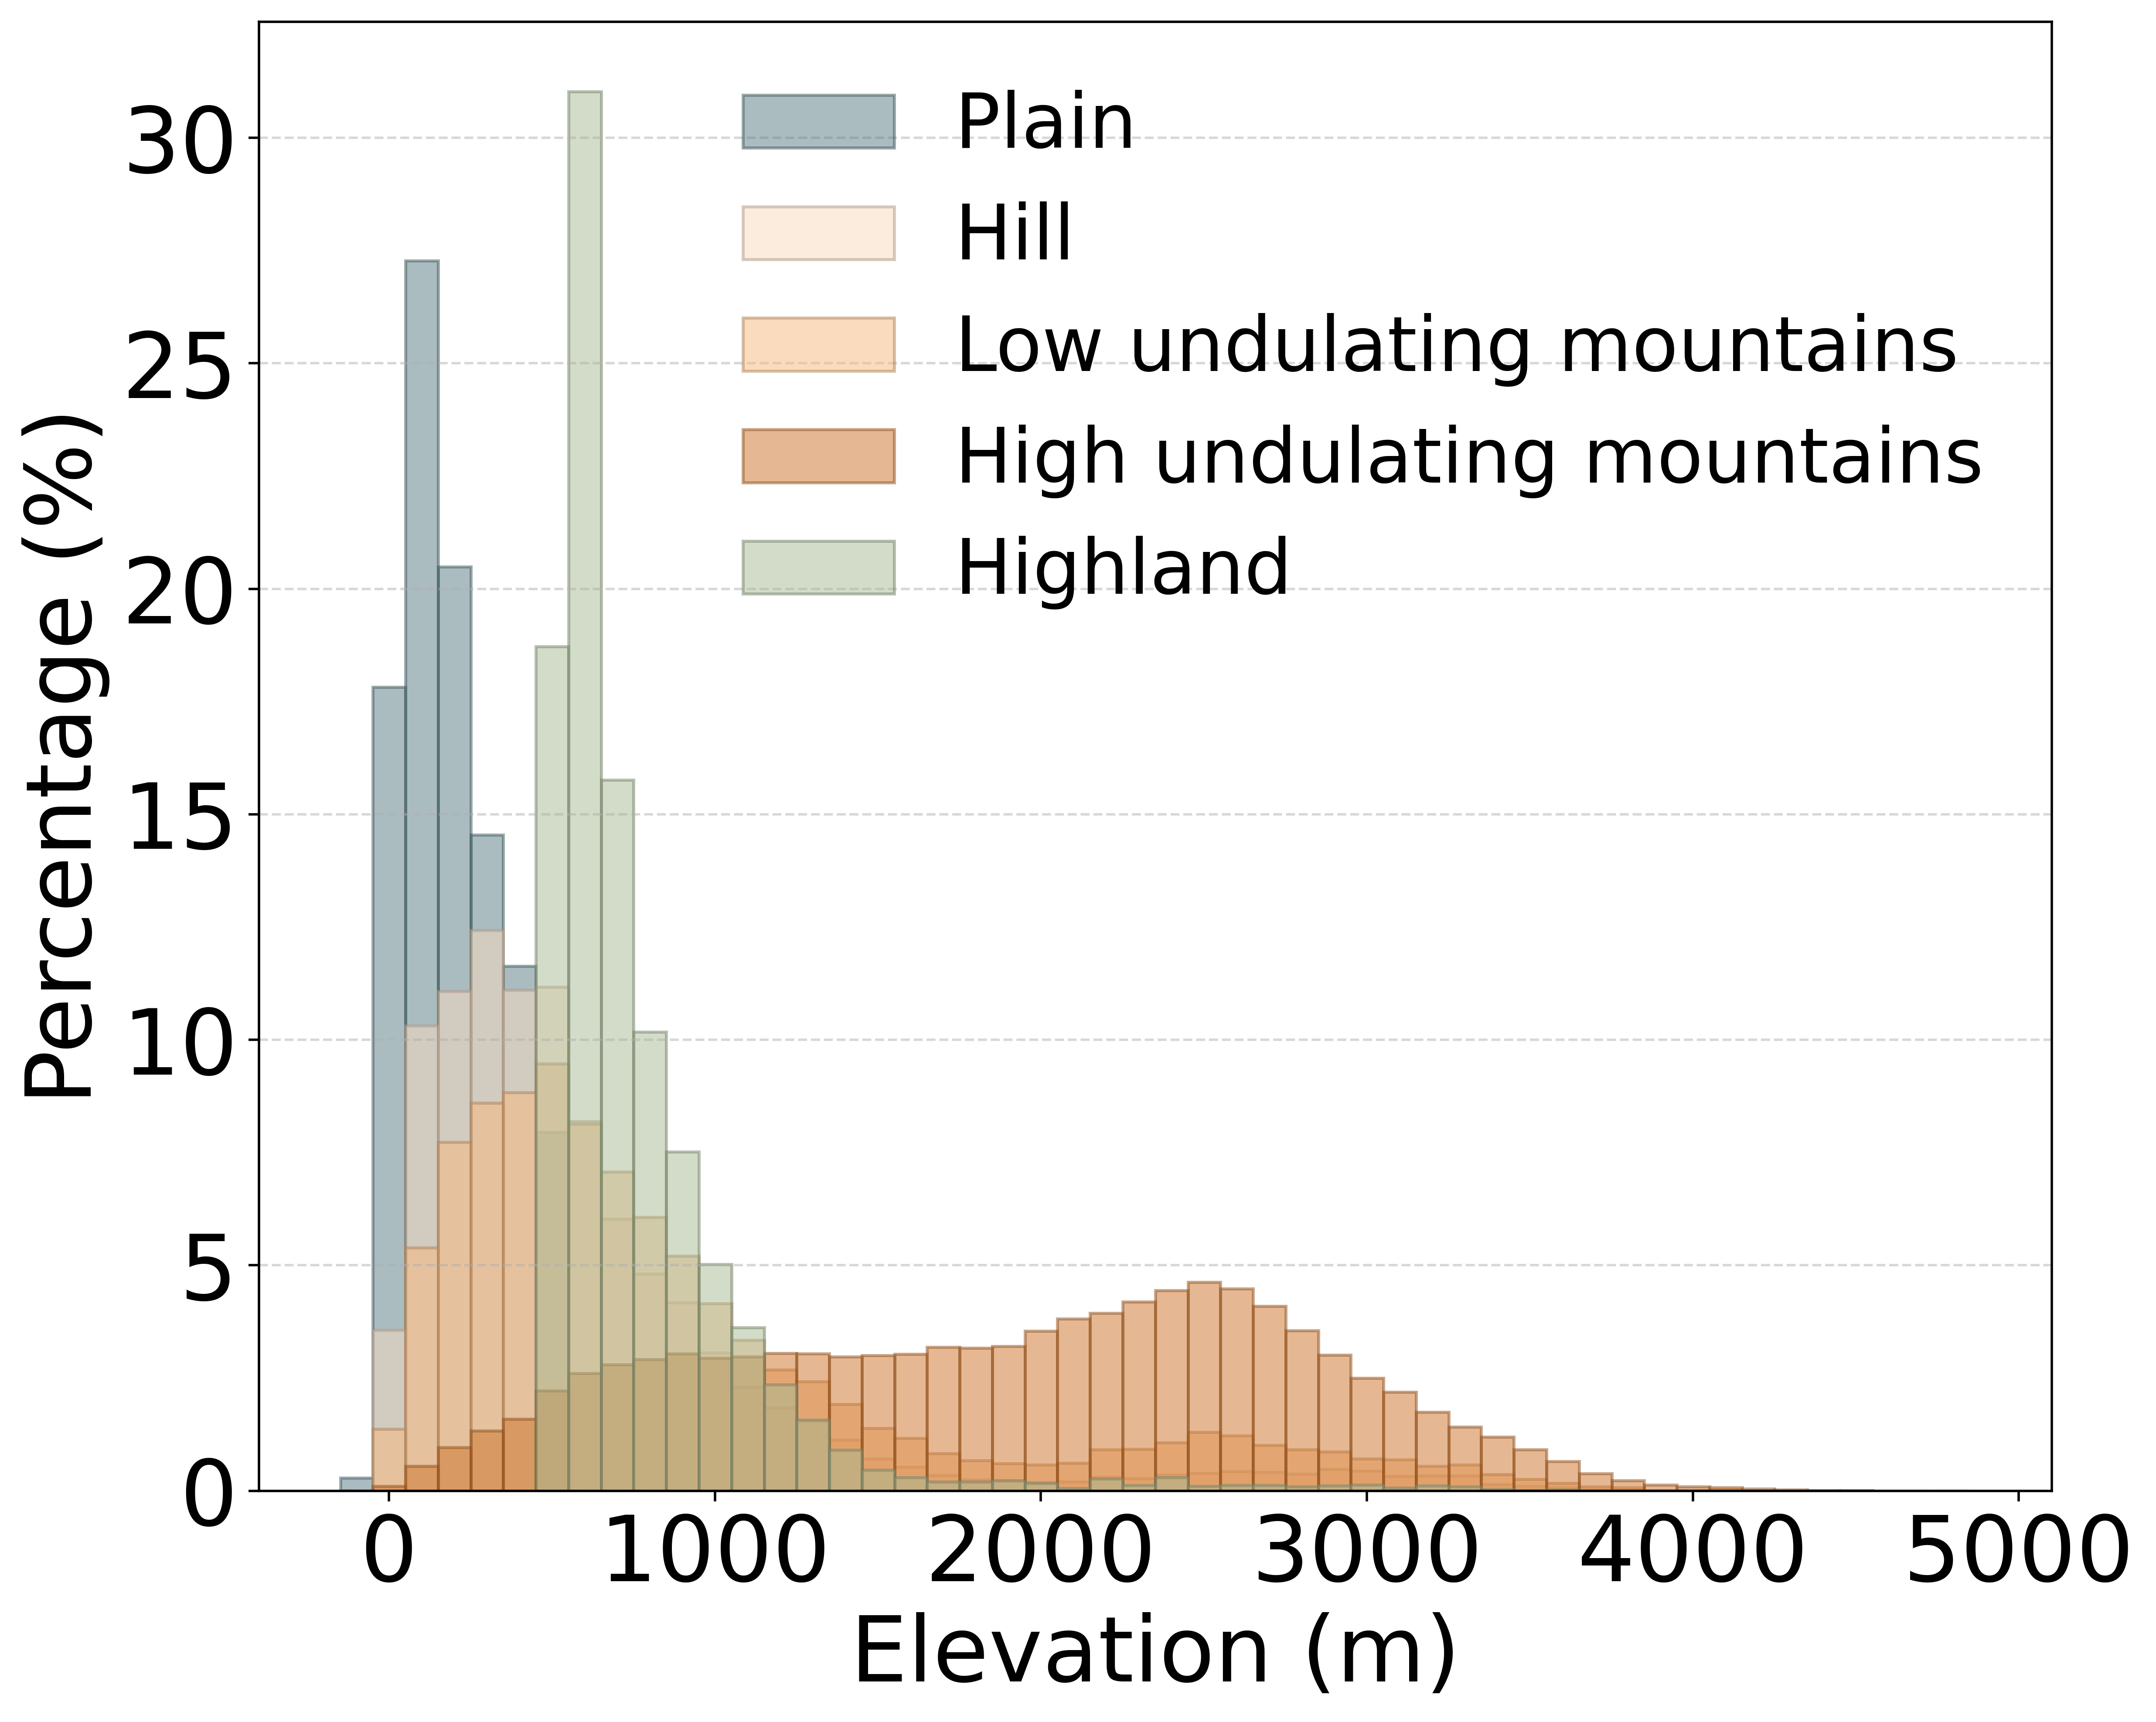
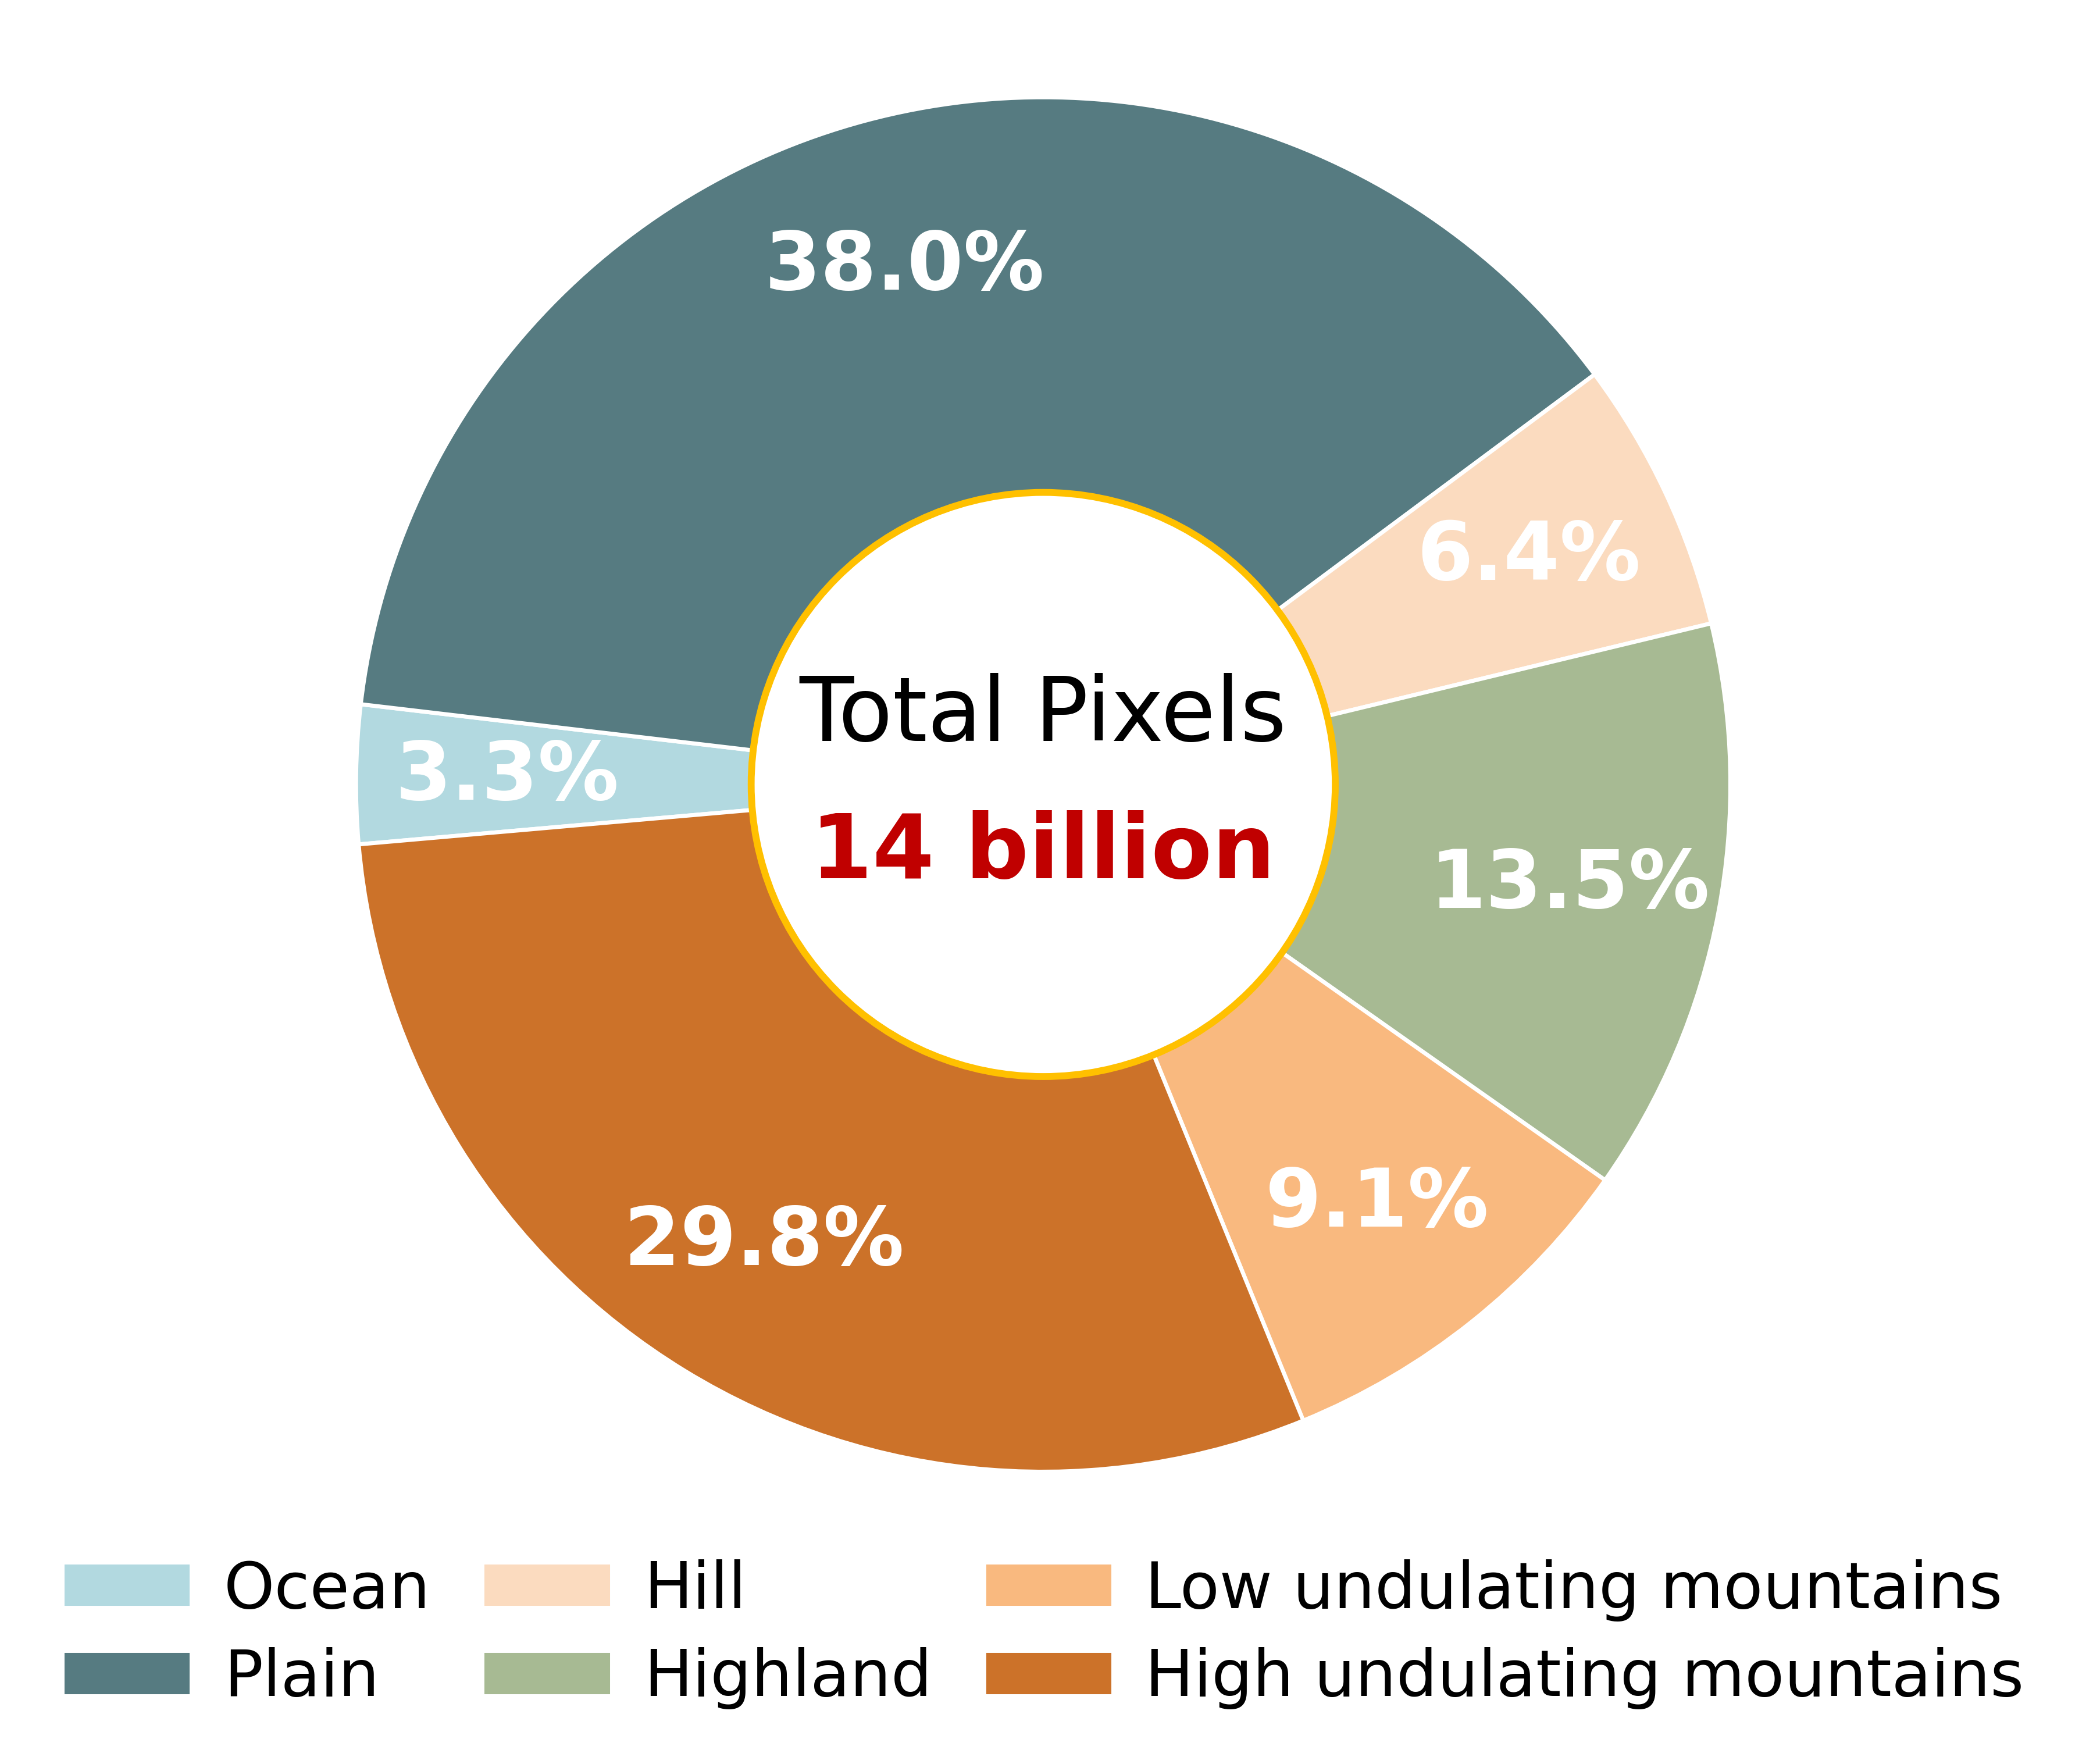
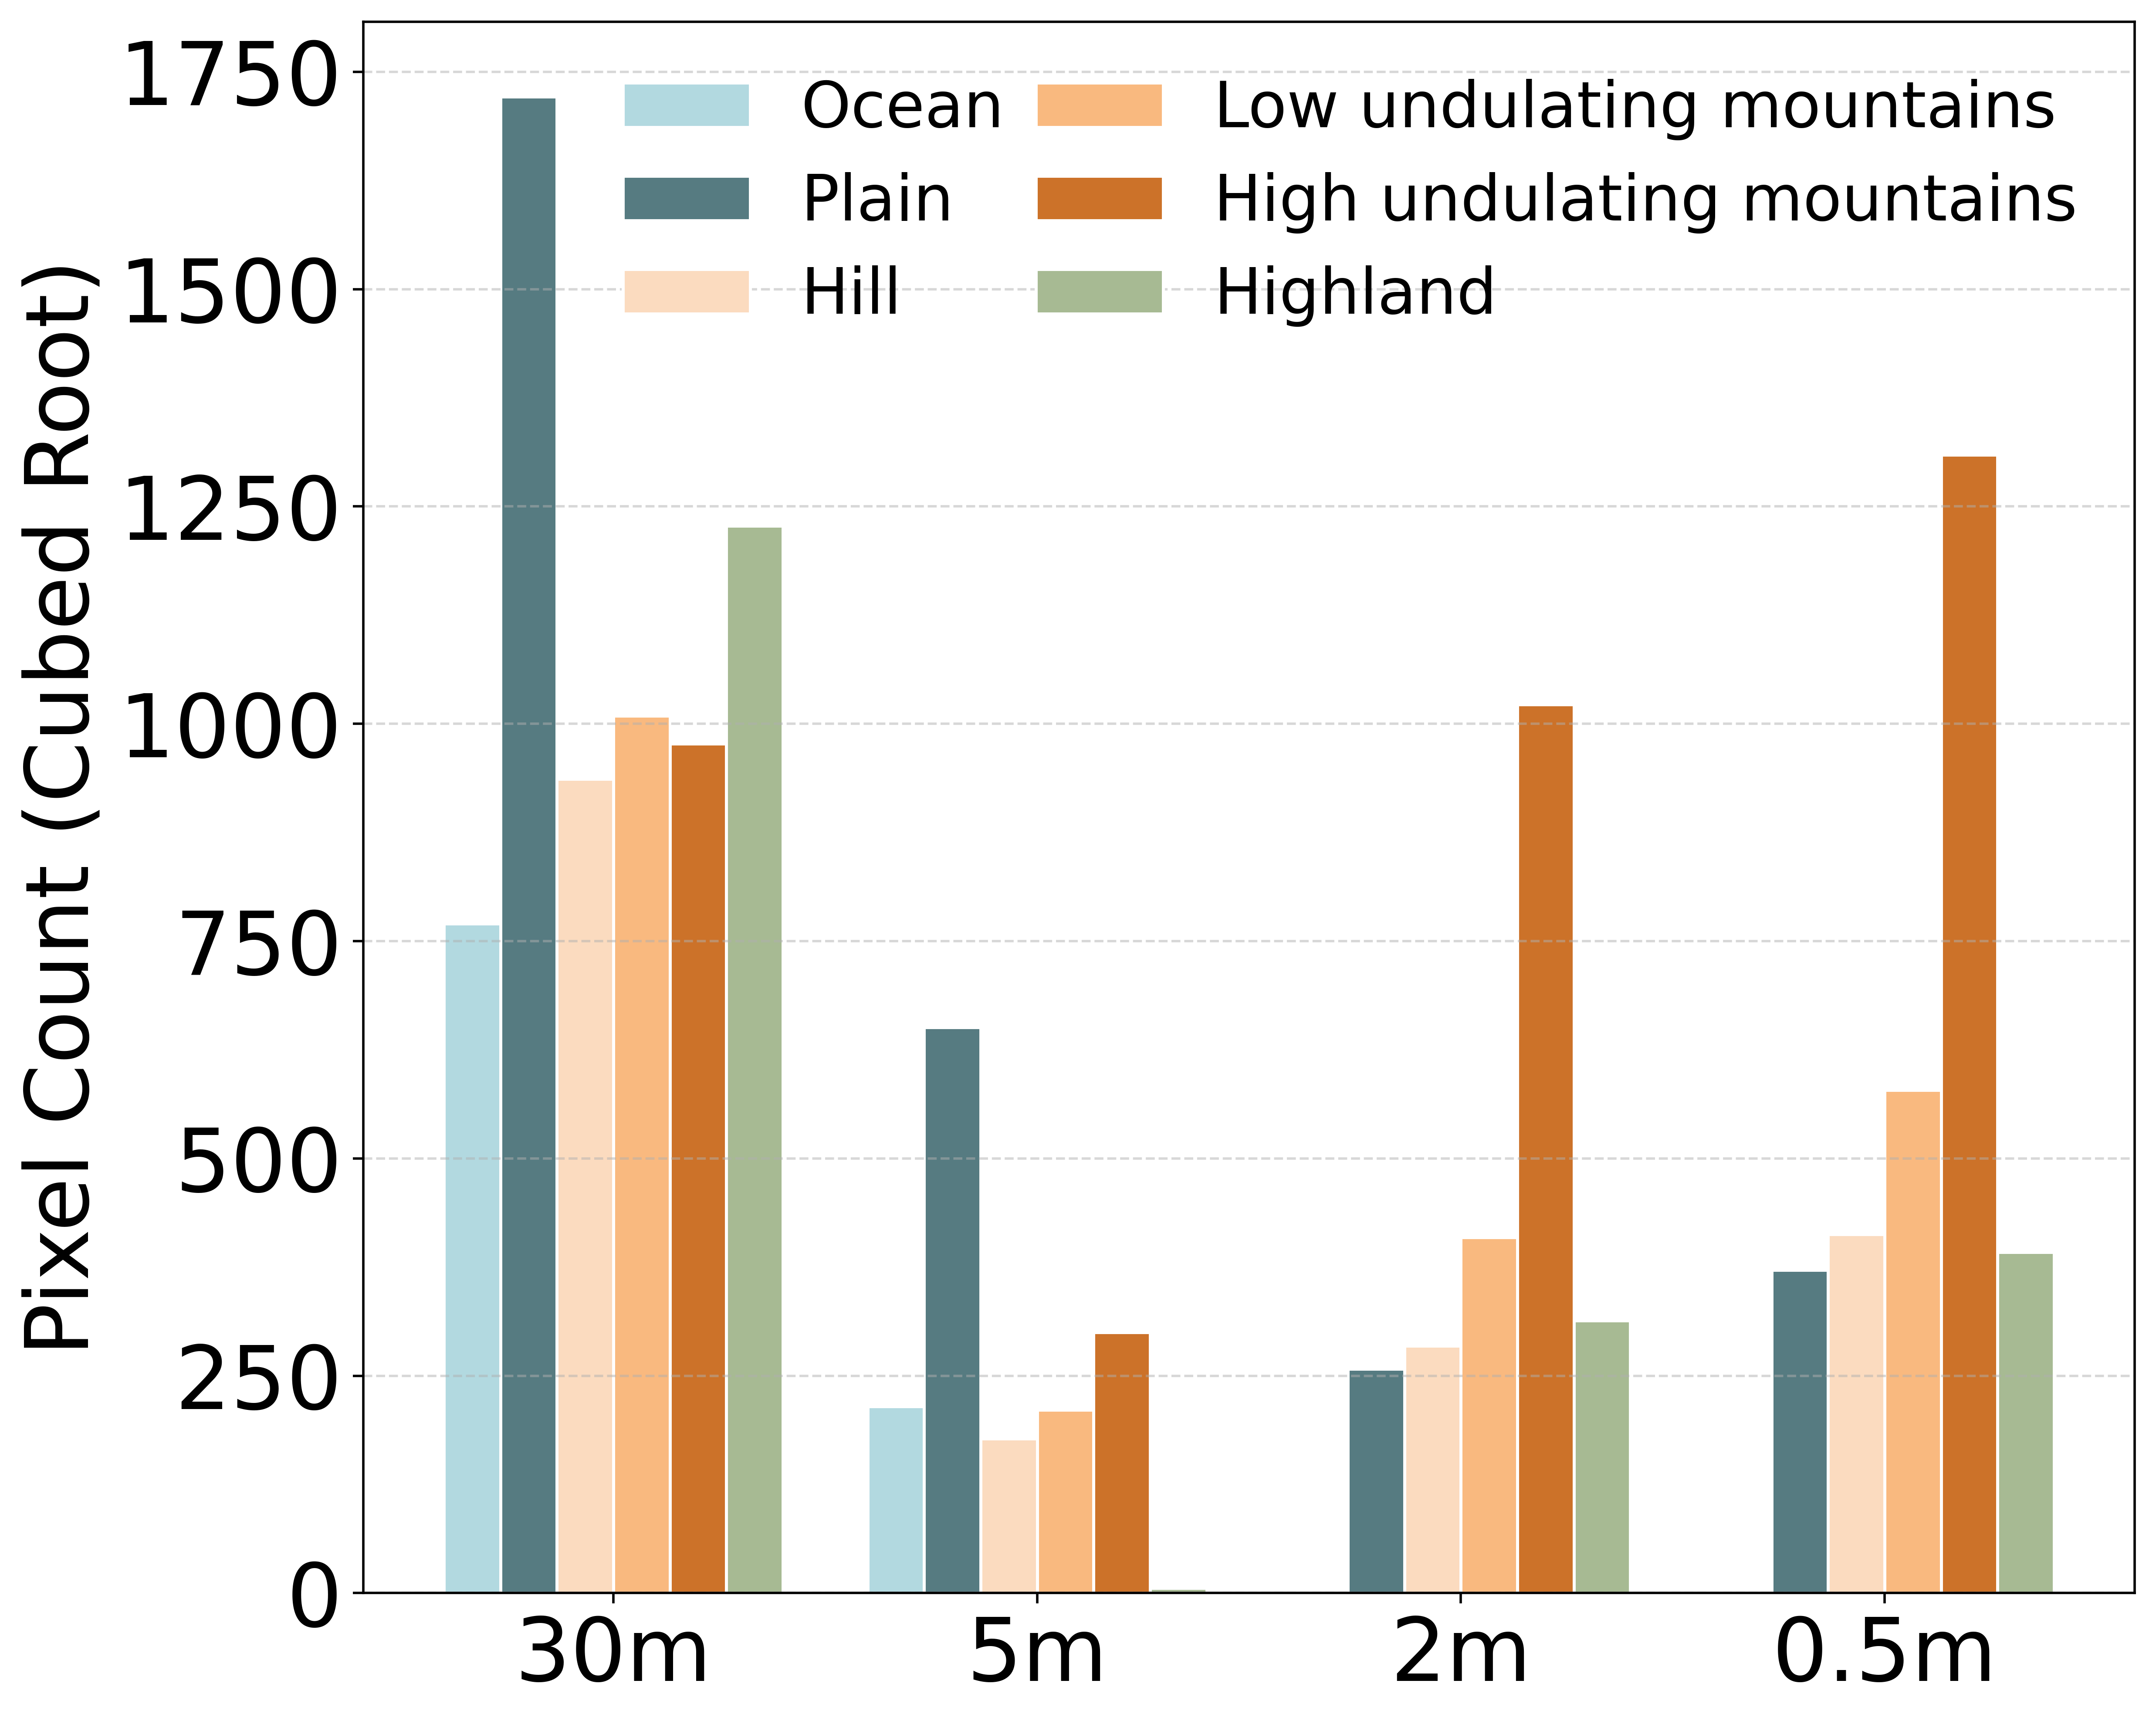
Figure 1 shows the distribution percentage of different terrains in the dataset at various altitudes, excluding the ocean(The main altitude of the ocean is 0), and the altitude range is distributed between -149 to 4813 meters, which is of great significance for large-scale remote sensing terrain modeling, effectively compensating for the shortcomings of existing depth estimation datasets in terms of large elevation changes and multiple terrain scenarios. Figure 2 presents the overall proportion of the six major terrain categories: ocean 3.3%, low undulating mountains 9.1%, hills 6.4%, plains 38.0%, Highland 13.5%, and high undulating mountains 29.8%, providing crucial support for model training in complex geographical scenarios. Figure 3 depicts the distribution of terrain counts at four resolutions (30 m, 5 m, 2 m, 0.5 m) with the cube root of the number of pixels as the vertical axis. The results indicate that low resolution (30 m, 5 m) datasets have a higher proportion of plains and Highland, while high-resolution (2 m, 0.5 m) primarily consists of mountainous types.
BenchMark